Fun with Graphviz and Associations
I expect that many of you are familiar with Graphviz, but if not, just note that it is a graph visualization project that allows to create graph images using a simple DSL. I’ve used it for a few things over the years and found it pretty helpful.
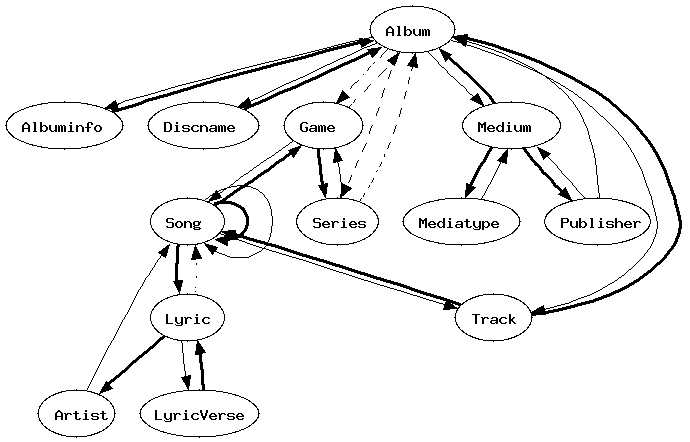
Recently, I wanted to write a program that would help me visualize the association relationships between Sequel models in some of my projects, so naturally I turned to Graphviz. With a fairly small ruby script named sequel_dot, it was easy to automatically generate code in the Graphviz DSL, which can be run with the Graphviz program dot to produce output like this:

Here, each model class is a node in the graph, and the edges are associations. It’s a directed graph, so the edges start with the model making the association, and end with the associated model. The display of the edges depends on the type of association, with many_to_one associations being bold, one_to_many associations being normal, many_to_many associations being dashed, and one_to_one associations being dotted.
Usage
If you’d like to generate graphics similar to this for your code, download sequel_dot. Then run it specifying the path to your model code. I generally have a file in my projects named models.rb so I can get an IRB shell with all of my Sequel models by doing:
irb -r models
If you have something similar, you’d run sequel_dot like this:
ruby sequel_dot models.rb > models.dot
If you are using a Sequel in a Rails project, you can try this:
ruby sequel_dot config/environment.rb app/models/*.rb > models.dot
sequel_dot just prints to stdout, which is why we are redirecting to a file. Then you run the dot program that comes with graphviz:
dot -Tgif models.dot > models.gif
That’s pretty much all you need to do to get it to work. Give it a try and respond with a link to the resulting output.
